Multi-year optimization of malaria intervention: a mathematical model
by: Harry J. Dudley, Abhishek Goenka, Cesar J. Orellana and Susan E. Martonosi
Abstract
Background
Malaria is a mosquito-borne, lethal disease that affects millions and kills hundreds of thousands of people each year, mostly children. There is an increasing need for models of malaria control. In this paper, a model is developed for allocating malaria interventions across geographic regions and time, subject to budget constraints, with the aim of minimizing the number of person-days of malaria infection.
Methods
The model considers a range of several conditions: climatic characteristics, treatment efficacy, distribution costs, and treatment coverage. An expanded susceptible-infected-recovered compartment model for the disease dynamics is coupled with an integer linear programming model for selecting the disease interventions. The model produces an intervention plan for all regions, identifying which combination of interventions, with which level of coverage, to use in each region and year in a 5-year planning horizon.
Results
Simulations using the model yield high-level, qualitative insights on optimal intervention policies: The optimal intervention policy is different when considering a 5-year time horizon than when considering only a single year, due to the effects that interventions have on the disease transmission dynamics. The vaccine intervention is rarely selected, except if its assumed cost is significantly lower than that predicted in the literature. Increasing the available budget causes the number of person-days of malaria infection to decrease linearly up to a point, after which the benefit of increased budget starts to taper. The optimal policy is highly dependent on assumptions about mosquito density, selecting different interventions for wet climates with high density than for dry climates with low density, and the interventions are found to be less effective at controlling malaria in the wet climates when attainable intervention coverage is 60 % or lower. However, when intervention coverage of 80 % is attainable, then malaria prevalence drops quickly in all geographic regions, even when factoring in the greater expense of the higher coverage against a constant budget.
Conclusions
The model provides a qualitative decision-making tool to weigh alternatives and guide malaria eradication efforts. A one-size-fits-all campaign is found not to be cost-effective; it is better to consider geographic variations and changes in malaria transmission over time when determining intervention strategies.
Keywords
Malaria policy Operations research Compartment model Integer programming
Background
Malaria remains a lethal disease affecting an estimated 200 million people and killing 627,000 in 2012 [1]. There are a variety of interventions for treating or preventing malaria infection, but the use of these interventions is hindered by scarcity of resources. Mathematical models provide a useful tool for evaluating intervention strategies and studying the relative effectiveness of interventions. These evaluations will become increasingly useful as success with malaria elimination is predicted to change transmission dynamics. In fact, the WHO Global Malaria Programme cites the specific need for operations research models to determine the best intervention strategies in areas where transmission dynamics are changing as malaria is being eliminated [2].
In this paper, an integer linear program (ILP) and a coupled susceptible-infected-recovered (SIR) compartment model are developed to create a decision-making tool for planning future interventions. The model suggests the best strategy for minimizing person-days of malaria infection over a 5-year period given an initial population, cost of each intervention, and a budget constraint. The model allows for the possibility of a malaria vaccine in combination with other interventions. Simulations are performed in which the budget, the efficacy of the interventions, and their cost are varied to determine the sensitivity of the optimal policy to these parameters.
Interventions
There are many existing methods to prevent or treat malaria infection. The model will consider the following five interventions and their combinations.
Long-lasting insecticidal nets (LLINs) cover sleeping individuals during the night when mosquito biting can be highest. When intact, the nets block mosquitoes from reaching humans. The insecticides work by deterring mosquitoes from feeding and by killing female mosquitoes that come in contact with the net. LLINs can remain effective for multiple years [3]. In fact, the WHO Pesticide Evaluation Scheme 2005 guidelines state that LLINs should survive at least 3 years of recommended washing and use [4].
Indoor residual spraying (IRS) is another insecticidal prevention method. IRS is believed to deter mosquitoes from entering sprayed areas and to kill female Anopheles mosquitoes that rest on sprayed surfaces after feeding. (Resting after feeding is a hallmark of some mosquito species while others prefer to rest outdoors [5]). Historically, IRS with an insecticide called dichlorodiphenyltrichloroethane was effective in reducing malaria in Europe, Asia, and Latin America. However, as insecticide use increases, insecticide resistance has been observed in some mosquito populations in Africa, and new insecticides must be used [1].
Intermittent preventive therapy (IPT) is the regular administration of a drug like sulfadoxine–pyrimethamnine to decrease morbidity due to malaria in infants, children, and pregnant women. IPT decreases the chance of developing symptoms after being bitten by an infected mosquito [6]. There is evidence that children withstand acute infection better than adults. However, in endemic areas, adults develop acquired immunity from repeated exposures, and children remain more susceptible to high levels of parasitaemia (parasite density in the blood) [7]. Most of the 627,000 people killed by malaria in 2012 were children in Africa, so giving IPT to infants, children, and pregnant women treats the most vulnerable population while limiting the risk of spreading drug resistance [1].
Artemisinin combination therapy (ACT) can be used to treat a patient after they contract malaria. This is the best treatment for uncomplicated P. falciparum malaria when confirmed by rapid diagnostic tests (RDT) [1, 8]. ACT kills the parasites that cause symptoms and may destroy or disable the gametocytes that are responsible for infecting mosquitoes [9]. Both these factors mean that ACT increases the recovery rate.
Many malaria vaccines are in development, and one has gone through Phase III clinical trials. The complex life-cycle of the malaria parasite makes it possible to intervene at many stages. Vaccines that target different forms of the parasite will operate by different mechanisms, but in general, a vaccine would decrease the chance of developing symptoms and increase the recovery rate if infected. The leading malaria vaccine candidate is the RTS,S malaria vaccine. It is an antigen composed of the RTS and S proteins. The RTS,S vaccine is a pre-erythrocytic vaccine that presents circumsporozoite protein (CSP) from malaria sporozoites to the immune system. CSP is a parasitic surface protein that is an important part of the invasion of hepatocytes by sporozoites [10]. Such a vaccine will decrease the probability that a susceptible person becomes infected after a bite from an infectious mosquito. Moreover, it is believed the vaccine could increase a person’s recovery rate by increasing their exposure to asexual blood-stage parasites, thereby boosting their immunity [10]. (By contrast, a transmission-blocking vaccine that acts in mosquitoes would decrease the probability of transmission from an infectious mosquito but would not change the human recovery rate).
Literature review
This paper extends a single-stage optimization model of Dimitrov et al. Their model divides the country of Nigeria into approximately 270,000 cells and chooses one action (either a single intervention or no intervention) for each cell over a year, subject to budget constraints, to minimize societal costs caused by malaria infection. The model also identifies optimal locations for supply distribution centres. They treat the societal benefit of each intervention as an exogenous parameter that depends on geographic characteristics. This allows their model to consider geographic variability in malaria dynamics [11].
However, because malaria dynamics depend on the fraction of the population that is infectious, a quantity that the interventions are themselves trying to reduce, the framework of Dimitrov et al. does not permit the examination of multiyear efforts against malaria in which the optimal policy might vary over time as the malaria dynamics shift. This paper extends the optimization model above to select interventions (or combinations thereof) over multiple years by explicitly incorporating malaria disease dynamics over time in response to those interventions. This is a novel approach that combines two areas of mathematics that do not regularly interact: ILP from the area of operations research and differential equations modelling from the area of mathematical epidemiology.
There is a long history of mathematical models of malaria transmission, going back to the work of Sir Ronald Ross in the early 1900s [12, 13]. In recent years, malaria has drawn significant attention from the academic community. Epidemiologists have traditionally modelled the spread of malaria in a population using variations on the SIR model to capture different aspects of the disease. Mandal et al. survey the models found in the literature and offer a hierarchy based on model complexity [13].
In order for the model presented here to make informed choices about which interventions to distribute, the dynamics of how disease transmission change after treatment interventions must first be understood. Lindblade et al. and Killeen et al. study the protective effect of insecticide-treated nets or LLINs [16]. Bousema et al. investigate how ACT reduces the circulation time of gametocytes, thereby reducing infectiousness [16]. Garner and Graves examine the community benefits of ACT [17]. Chandramohan et al., Grobusch et al., and Aponte et al. quantify the protective effects of IPT for infants [6, 18, 19]. Pluess et al. review the effects of IRS [5]. These results are used to inform the model’s choice of disease transmission parameters, as described later under “Effects of interventions on SIR parameters” section.
The model presented here includes in its portfolio of interventions a vaccine that is currently in development. Prosper et al. model the interaction between vaccine- and naturally-acquired immunity using a five-compartment model. Their model augments the S, I, and R classes with a partially-immune (due either to vaccination or natural immunity) susceptible class and a moderately-infectious class for infected, partially-immune individuals. They find that disease burden can be decreased only if a highly effective vaccine is coupled with a policy of actively treating asymptomatic infections in partially immune individuals [20]. Bojang et al. report there is minimal potential effect for a malaria vaccine given to adult men, and Asante et al. study the positive potential protective benefits of administering the vaccine to children [21, 22].
There are extensions to the SIR framework that are not considered here. Koella and Antia model the reduced efficacy of interventions due to the spread of drug-resistant strains of malaria [23]. The model presented here does not incorporate drug-resistance, so any policy recommended by the model should be evaluated in this context. Other researchers, for example Dawes et al. [24] and Koudou et al. [25], focus on the mosquitoes’ plasmodial transmission dynamics by analysing the effects of interventions on mosquito morbidity and mortality rates and the usefulness of the resulting manipulation of said rates. The changing mosquito population is not modelled explicitly; instead the effects of interventions on the mosquito population are represented as changes in the parameter values used in the human SIR model.
While the above references provide detailed models of malaria’s complex dynamics, this paper presents a simple SIR model that accommodates the effects of several types of interventions, while maintaining the computational tractability required by the optimization model. In the next section, the model and simulation approach are described in greater detail.
Methods
This paper considers the problem of allocating malaria treatments to many regions when limited by scarce resources. There is assumed to be a fixed annual budget shared across several geographic regions having different initial incidences and transmission rates of malaria and different unit costs for distributing treatment. A portfolio of interventions can be selected, including some in combination, each having its own effects on malaria transmission. Each intervention is selected at a particular coverage, which is the percentage of the population that receives the intervention and uses it correctly. Social and economic losses are assumed to be proportional to the time spent infectious, so person-days of malaria infection is the chosen measure of the malaria burden. The model identifies the optimal sequence of interventions and corresponding coverage percentages for each region and each year that minimizes the total infected person-days over a fixed time horizon.
An integer linear programming optimization model (ILP) suggests the best set of interventions in each year to minimize person-days of malaria infection over all time steps. The ILP takes as input the number of person-days of malaria infection that occur when a given intervention is used on a population with a given initial prevalence of malaria. The person-days of malaria infection is estimated by a SIR differential equations model of malaria transmission dynamics.
Integer linear programming (ILP) model
The ILP relies on several sets, parameters, and decision variables, which are defined here.
Sets
Geographic regions Because the cost of distributing an intervention to a particular district depends on its infrastructure and ease of access to treatment, and the malaria transmission dynamics depend on its climate, districts are grouped into geographic regions, denoted by index g. The optimization model determines the number of districts in each geographic region to receive a particular sequence of interventions.
Population states A population state, p, is a triplet, (S, I, R), that indicates the percentage of a district’s population susceptible to (S), infected by (I), or recovered from and temporarily immune to (R) malaria. Each district begins a year in a particular population state and ends in a new population state that depends on how the chosen intervention affects the malaria disease dynamics. (The model for determining the disease progression is described in the “Differential equations (DE) model” section).
Actions The set of actions is the set of possible choices of intervention (including certain combinations of interventions, or the possibility of applying no intervention). The choice of intervention at a determined coverage level in a district is referred to as an action, denoted by index i.
Parameters
Ainigpq :
is an indicator variable whose value is 1 if action i applied to a district of geographic region g, initially in population state p causes a transition to population state q, and 0 otherwise.
Aoutigp :
is an indicator variable whose value is 1 if action i applied to a district of geographic region g, initially in population state p causes a transition to a different population state, and 0 otherwise.
Bt :
is the annual budget for year t; the combined cost of actions across all districts in year t must not exceed this value.
Cig :
is the cost of action i in any district in geographic region g.
Ipg :
is the number of districts in geographic region g that are initially in population state p at the first time step.
Lipg :
is the number of person-days of malaria infection incurred in a district in geographic region g, initially in population state p, under action i.
N :
is a number larger than the total number of population states.
T :
is the time horizon, in years, considered by the model.
Decision variables
Ppgt :
is the number of districts in geographic region g that are initially in population state p at the start of year t.
aOUTipgt :
is the number of districts in geographic region g that are initially in population state p at the start of year t and are assigned action i.
aINipqgt :
is the number of districts in geographic region g that are initially in population state p at the start of year t, are assigned action i, and end in population state q.
Model
Using these sets, parameters and decision variables, the following ILP can now be defined.
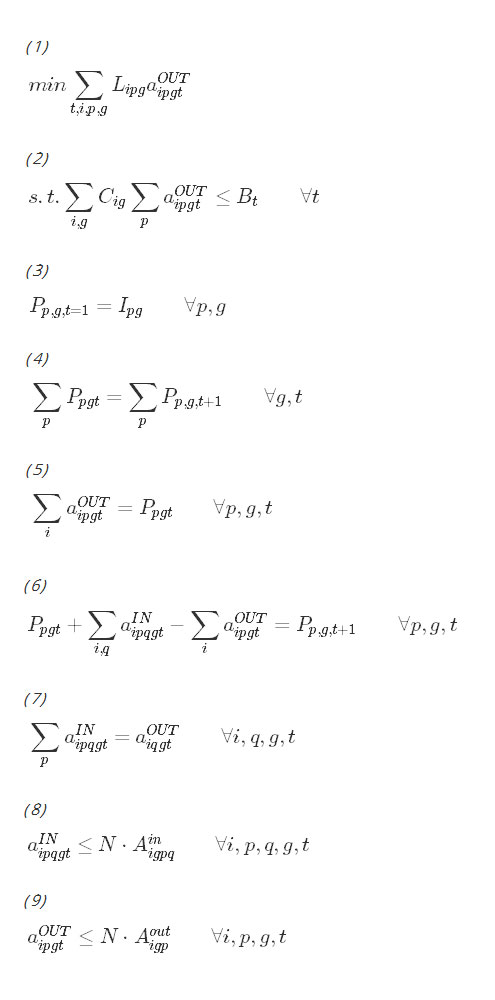
The objective function in expression (1) minimizes the cumulative person-days that each district spends in the infected state over the time horizon, as a function of the model’s choice of actions. Constraint (2) requires the chosen set of interventions to be within budget in each year. Constraint (3) initializes the population variable at the start of the time horizon. Constraints (4), (5), (6) and (7) are bookkeeping constraints that keep track of the number of districts in each geographic region and population state as a function of the actions chosen. Constraints (8) and (9) assure that districts transition out of population state p to population state q only when an appropriate action has been taken. The last constraint requires all decision variables to be nonnegative integers.
Differential equations (DE) model
Several of the parameters used by the ILP model, specifically Ainigpq, Aoutigp and Lipg depend on the dynamics of malaria progression. The SIR model is a standard system of nonlinear ordinary differential equations for analysing the transmission of malaria [13, 23]. In this paper, the standard model is modified to use a coupled six-class compartment model with separate SIR compartments for treated and untreated individuals. This coupling of treated and untreated SIR classes permits modelling of population-wide benefits caused by decreased infectiousness of a treated subpopulation. For an initial population state and action, this system of equations is solved to determine the population state after 1 year. This yields the indicator parameters Ainigpq and Aoutigp. The solution to this system of differential equations is also used to estimate the burden of malaria, measured in infected person-days, during that year. For each district in geographic region g, beginning the year in a particular population state p, having been assigned action i, the infected class curve that results under those conditions is numerically integrated, multiplied by the district’s population. This estimates the number of people who are infected over the year times the number of days for which they remain infected. This number is then input into the linear programming model as the value of Lipg. This is pre-solved for all possible population states and actions, and the results are stored as input data for the ILP.
The parameters, state variables and system of differential equations are now defined.
Parameters
au (at):
is the number of bites per mosquito per untreated (respectively, treated) human per day.
bu (bt):
is the transmission efficacy from infected mosquito to susceptible, untreated (resp., treated) human.
c :
is the transmission efficacy from infected human to susceptible mosquito.
δ :
is the daily birth rate and death rate. Constant population is assumed.
γu (γt):
is the recovery rate for untreated (resp., treated) people. Its reciprocal is the average time that a person is infected with malaria.
hu (ht):
is the force of infection, that is, the rate at which untreated (resp., treated) susceptible humans become infected with malaria.
mu (mt):
is the number of mosquitoes per untreated (resp., treated) human.
μ :
is the mosquito mortality rate.
ω :
is the duration of immunity without reinfection.
q :
is the treatment coverage, the percentage of the population that receives a treatment and uses it correctly. It is assumed that the same percentage of newborns are born into the susceptible, treated class. The remaining fraction, 1−q, are born into the susceptible, untreated class.
ρu (ρt):
is rate of immunity loss for recovered untreated (resp., treated) humans.
τ :
is the incubation period of malaria in the mosquito.
State variables
Su (St):
is the proportion of the population that is susceptible and untreated (resp., treated).
Iu (It):
is the proportion of the population that is symptomatic, infectious, and untreated (resp., treated).
Ru (Rt):
is the proportion of the population that is recovered with acquired immunity and untreated (resp., treated).
Model The proportions of the population belonging to each of the six classes can be determined by solving the following system of differential equations:
Although on the surface, the equations for the untreated population and the equations for the treated population do not appear to be coupled, the coupling occurs with the parameters hu and ht, which are the force of infection parameters. They have been derived by Smith and McKenzie [26] to be:
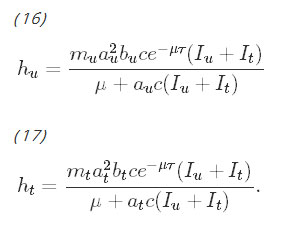
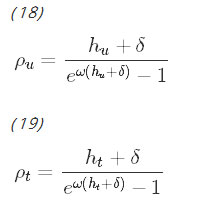
Observe that these rates are functions of the total proportion of infectious people, Iu+It, which couples the system of differential equations. The more infectious people there are in either the untreated or treated group, the faster the rate at which susceptible people in either group can become infected. The rates of immunity loss, ρu and ρt, are functions of hu and ht, respectively and further couple the system. The procedure for deriving the rate of immunity loss has been shown by Aron and May [27]. These equations assume that being exposed to malaria while recovering resets the duration of immunity.
This is a general model that does not consider the effect an intervention can have on the transmission of the disease. In the specific case of ACT, a medication that clears infection rapidly, the length of time a malaria patient is carrying infectious gametocytes in her blood is significantly reduced [16, 28]. Because of this, the model makes the assumption that ACT clears parasites before the body has time to develop acquired immunity; therefore, infected people treated with ACT are assumed to skip the recovered class and transition directly back to the susceptible class. To reflect this, the indicator variable ψact is introduced, which equals 1 when ACT is chosen (either alone or in combination with another intervention), and 0 otherwise. The state equations for the untreated class are unchanged, and the equations for the treated classes become:
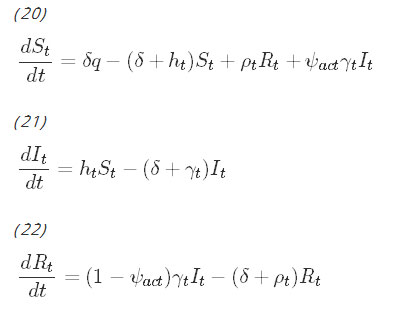
Observe that when ACT is used, infectious individuals bypass the recovered class and transition directly to the susceptible class.
Because a new portfolio of interventions is selected each year, the effects of treatment are assumed to last for 1 year, exactly. Some of the treatments are known to last longer; for instance, the insecticide coating on mosquito nets is believed to be effective for 3 years, and vaccines in development currently have an efficacy of 3 years. However, assuming a duration of only 1 year is conservative: under this assumption, the model will underestimate the efficacy of the interventions, and the results expected to be seen in the field should be better. Under this assumption, at the end of each year, the six-state population (Su,Iu,Ru,St,It,Rt) can be collapsed into a more compact three-state representation: (Su+St,Iu+It,Ru+Rt).
Coverage
The coverage, q, refers to the percentage of the population that receives a treatment and uses it correctly. For example, if at the start of the year, the percentages of the population who are susceptible, infected and recovered are given by (S, I, R), respectively, then the initial values of Su,Iu,Ru,St,It, and Rt for the differential equations model will be (1−q)S,(1−q)I,(1−q)R,qS,qI, and qR, respectively.
However, some interventions, such as IPT and vaccine, are assumed to be distributed only to newborns and children under the age of four. In these cases, the coverage, q, applies only to births and to the fraction of the population under the age of four. If x is the fraction of the population under the age of four, and (S, I, R) is the initial distribution of susceptible, infected and recovered individuals in the population, then the initial values of Su,Iu,Ru,St,It, and Rt for the differential equations model will be (1−qx)S,(1−qx)I,(1−qx)R,qxS,qxI, and qxR.
Data
The model relies on parameters governing intervention costs, malaria transmission, and intervention efficacy. When available, parameter values are estimated based on malaria research literature. When using country-specific information, data from Kenya or its neighbours are used as it is more readily available and permits consistency across parameters. This paper also presents sensitivity analysis to understand how the model’s results would change under a range of scenarios concerning distribution costs, climate and intervention efficacy. In this section, the costs of the interventions are described first, followed by the baseline parameter values used in the SIR model. Then, the changes in these parameter values under interventions and sensitivity analysis scenarios are described.
Base costs of interventions
The model parameter Cig is the per person, per year cost of action i in any district in geographic region g. The cost of an action depends on the purchase price as well as transportation and distribution costs, which are assumed to be regional. For the base cost, the simulations use data provided by White et al., who survey cost and cost-effectiveness data for LLIN, IRS, IPT, and ACT from all available sources and adjust it to 2009 USD [29]. The simulations primarily use data from Kenya, except where noted that no Kenya-specific data was available; in these cases, cost estimates from nearby Ethiopia, Tanzania and Zimbabwe are used. Listed here are the base costs for each intervention; the subsequent section describes how to modify those costs to reflect transportation and distribution costs in different geographic regions. These are summarized in Table 1.
Table 1
Baseline cost for using interventions, per treated person for 1 year, in 2009 USD [29, 30, 31]
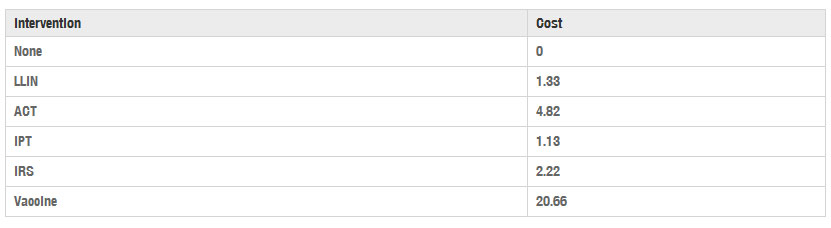
LLIN The average cost of a single insecticide-treated mosquito net is 7.21 USD [29], and the WHO Pesticide Evaluation Scheme 2005 guidelines estimate a 3 year life span with recommended use [4]. Because the model assumes all actions expire at the end of 1 year, an annual cost per net of 2.40 USD is used, which is one-third the base cost of the net. Moreover, bed-sharing is a common practice that further reduces the per-person cost of each distributed net. The World Health Organization recommends the assumption that an LLIN will protect 1.8 people, on average [30], making the annual per-person cost 1.33 USD.
IRS The IRS cost estimate assumes two rounds of household spraying with lambda cyhalothrin per person per year, at an annual cost of 2.22 USD [29].
IPT White et al. summarize cost estimates for distributing IPT to newborns, children and pregnant women. The mean cost of distributing six bi-monthly doses of sulfadoxine–pyrimethamine to infants in Tanzania is reported to be 0.78 USD, and three doses per year to children in Kenya is 1.25 USD [29]. As roughly 25 % of children under the age of 4 are infants, the simulations use an estimated weighted average annual cost for IPT of 1.13 USD.
ACT White et al. report malaria diagnosis and treatment costs for a variety of diagnostic methods and treatment types in several countries. For consistency, the simulation uses costs associated specifically with RDT used in conjunction with ACT treatment in the countries of Tanzania and Zambia. These range from 3.63 USD to 6.72 USD, with an average of 4.82 USD per person treated [29]. Unlike interventions such as LLINs, which are assumed to be distributed to the entire treated class, ACT is distributed only to members of the treated class who experience a malaria infection. Therefore, the SIR model must estimate the number of new malaria infections per year to determine the annual cost of ACT. According to Eq. (21), new infections occur with rate htSt=dItdt+(δ+γt)It. Note that dItdt can be approximated by It(d+ϵ)−It(d)ϵ for small ϵ. Discretizing the year over which the treatment is available into 365 days and letting ϵ=1 day, the number of new infections appearing on day d should be roughly It(d)−(1−(δ+γt))It(d−1) times the total population. Summing this value over all days d should give an approximation of the number of new infections incurred during the year, and hence, the number of people who received ACT.
Vaccine Cost data for the RTS,S vaccine is not yet available since the vaccine is not yet on the market. Seo et al. use an estimate of 7 USD per dose for the vaccine after looking at recent introductory vaccine prices ranging from 1 to 15 USD [31]. They also propose using 0.37 USD administration cost per vaccination based on the price for other vaccines used in Malawi in the Expanded Program on Immunization (EPI). Because the RTS,S vaccine is administered in three doses, they estimate the total cost of the vaccine at 22.11 USD per person per year [31]. Adjusting their 2012 costs to 2009 values for consistency yields a cost of 20.66 USD per treated person per year [32].
Baseline SIR model parameter values
The baseline parameter values used in the SIR model are now described; the following section discusses how the interventions and modelling assumptions affect those values. This information is summarized in Table 2.
au is the number of bites per mosquito per untreated human per day, which is estimated to be 0.25 [33].
bu is the transmission probability from infected mosquito to susceptible, untreated human, which is estimated to be 0.022 [33].
c is the transmission probability from infected human to susceptible mosquito, which is estimated to be 0.36 [33].
δ is the daily birth rate and death rate. In Kenya in 2014, the estimated annual birth rate was 0.02827 births per person, and the estimated annual death rate was 0.007 deaths per person [34]. Because the model assumes a constant population, the average of these, or 0.017635 births (deaths) per person per year, is converted using compounding to a daily birth (death) rate of δ=4.7895×10⁻⁵.
γu is the recovery rate for untreated people. Filipe et al. estimate the average infectious period for untreated people to be 180 days, making γu=1180 [35].
mu is the mosquito density (number of mosquitoes per untreated human), which is estimated to be 20 [13].
μ is the mosquito mortality rate, estimated to be 0.095 days−1 [35, 36].
ω is the duration of immunity without reinfection. The value ω=274 days, is based on an estimate that immunity lasts between 6 and 12 months [37].
q is the treatment coverage, the percentage of the population that receives a treatment and uses it correctly. Three levels of treatment coverage for each intervention are considered: high (60 %), medium (40 %), and low (20 %).
τ is the incubation period in the mosquito, estimated to be 10 days [36].
x is the fraction of the population that is age 4 years or younger, which was approximately 14.6 % in Kenya in 2014 [34].
The expressions given in Eqs. (16), (17), (18) and (19) are used to determine the force of infection (hu and ht) and the recovery rate (ρu and ρt).
Table 2
Malaria transmission parameter values for the baseline, untreated case (corresponding to the subscript “u”) and treatment cases (corresponding to the subscript “t”)
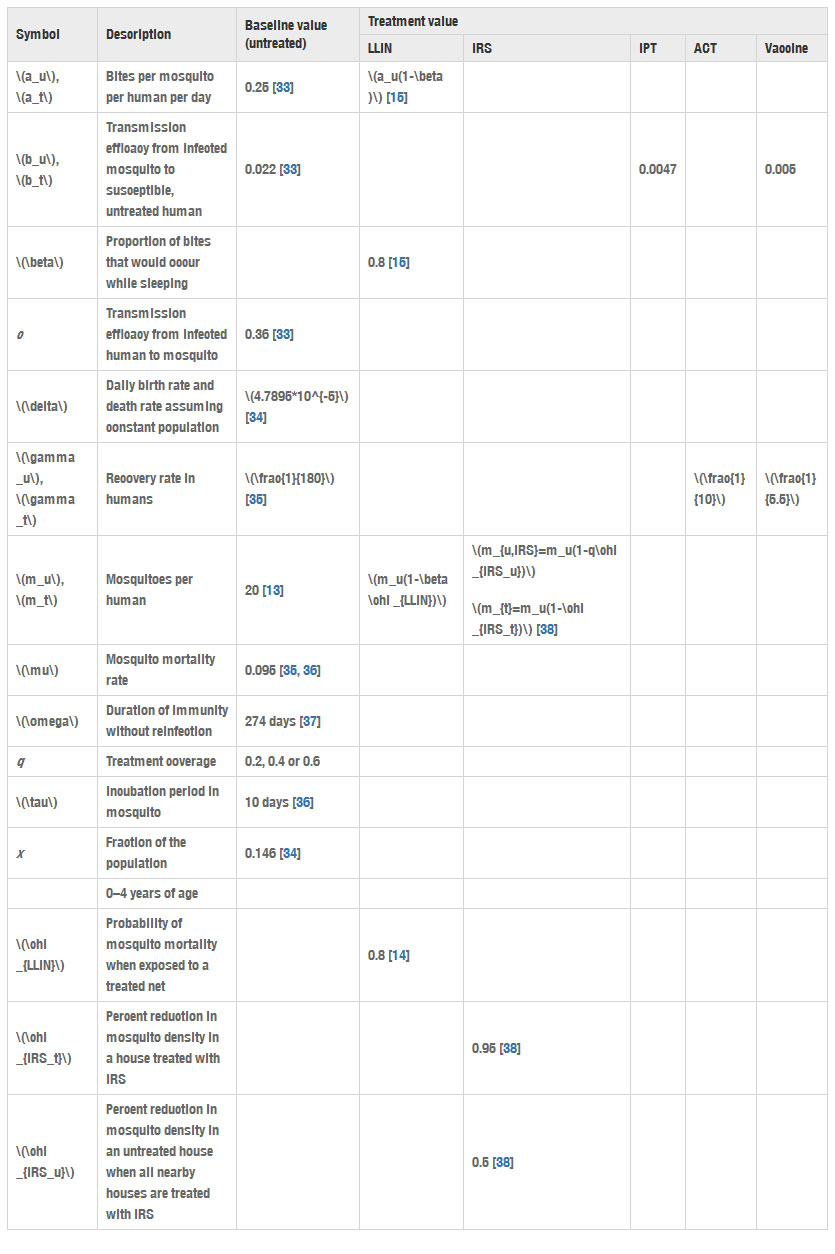
In the baseline value column, an empty space means that the parameter does not apply to the baseline, untreated case. In the treatment value columns, an empty space means that the parameter is unchanged by that particular intervention
Note that the malaria transmission parameters, au, bu, c, and mu, are very location-specific (see [36], p. 409). Adapting this model to any location would require re-estimating these parameters.
Effects of interventions on SIR parameters
Each intervention, or combination of interventions, is modelled as affecting a subset of the above parameters. LLINs protect individual users by decreasing the biting rate, at, and by killing mosquitoes that contact the insecticidal nets, thus decreasing mt. The values of at and mt are estimated as follows:
Let β be the proportion of mosquito exposure that occurs during sleeping hours.
Let χLLIN be the probability of mortality for a mosquito exposed to a treated net.
As before, let mu be the baseline mosquito density absent any treatment.
Then Killeen et al. [15] derive the value of at for people using LLIN as
(23)
at=au(1−β),
and the value of mt for people using LLIN as
(24)
mt=mu(1−βχLLIN).
Although Fig. 5 in reference [15] shows a slight increase in overall protection for the treated class as a function of q, this increase is modest in the range of q considered here, and so mt is assumed to be independent of q. Additionally, Killeen et al. suggest that as treatment coverage increases in a population, even non-users of LLINs benefit from decreased mosquito density. However, the authors were unable to find empirical data to support a robust model of mosquito density in the untreated population as a function of treatment coverage; therefore, the model assumes that the untreated population experiences the baseline mosquito density, mu, for all values of q.
To determine the new biting rate, at, and the new mosquito density, mt, for the treated classes, Eqs. (23) and (24), respectively, are used with β=0.8 [15] and χLLIN=0.8 [14], and with au=0.25, and mu=20 as given earlier. IRS decreases the number of mosquitoes per treated human, mt, in a similar manner as LLINs. Moreover, IRS can also decrease the mosquito density in untreated areas close to treated areas; thus, mu is also affected by IRS [38]. Let χIRSt be the reduction in mosquito density in a house treated with IRS, and let χIRSu be the reduction in mosquito density in an untreated house when the treatment coverage is 100 % in a nearby area. Then the value of mt for a house treated with IRS is
Link to Website:https://malariajournal.biomedcentral.com/articles/10.1186/s12936-016-1182-0
<addhtml>